Visualize Your Postgres Data in Real Time
Transform complex database queries into beautiful, interactive dashboards. Monitor performance, track metrics, and make data-driven decisions faster.
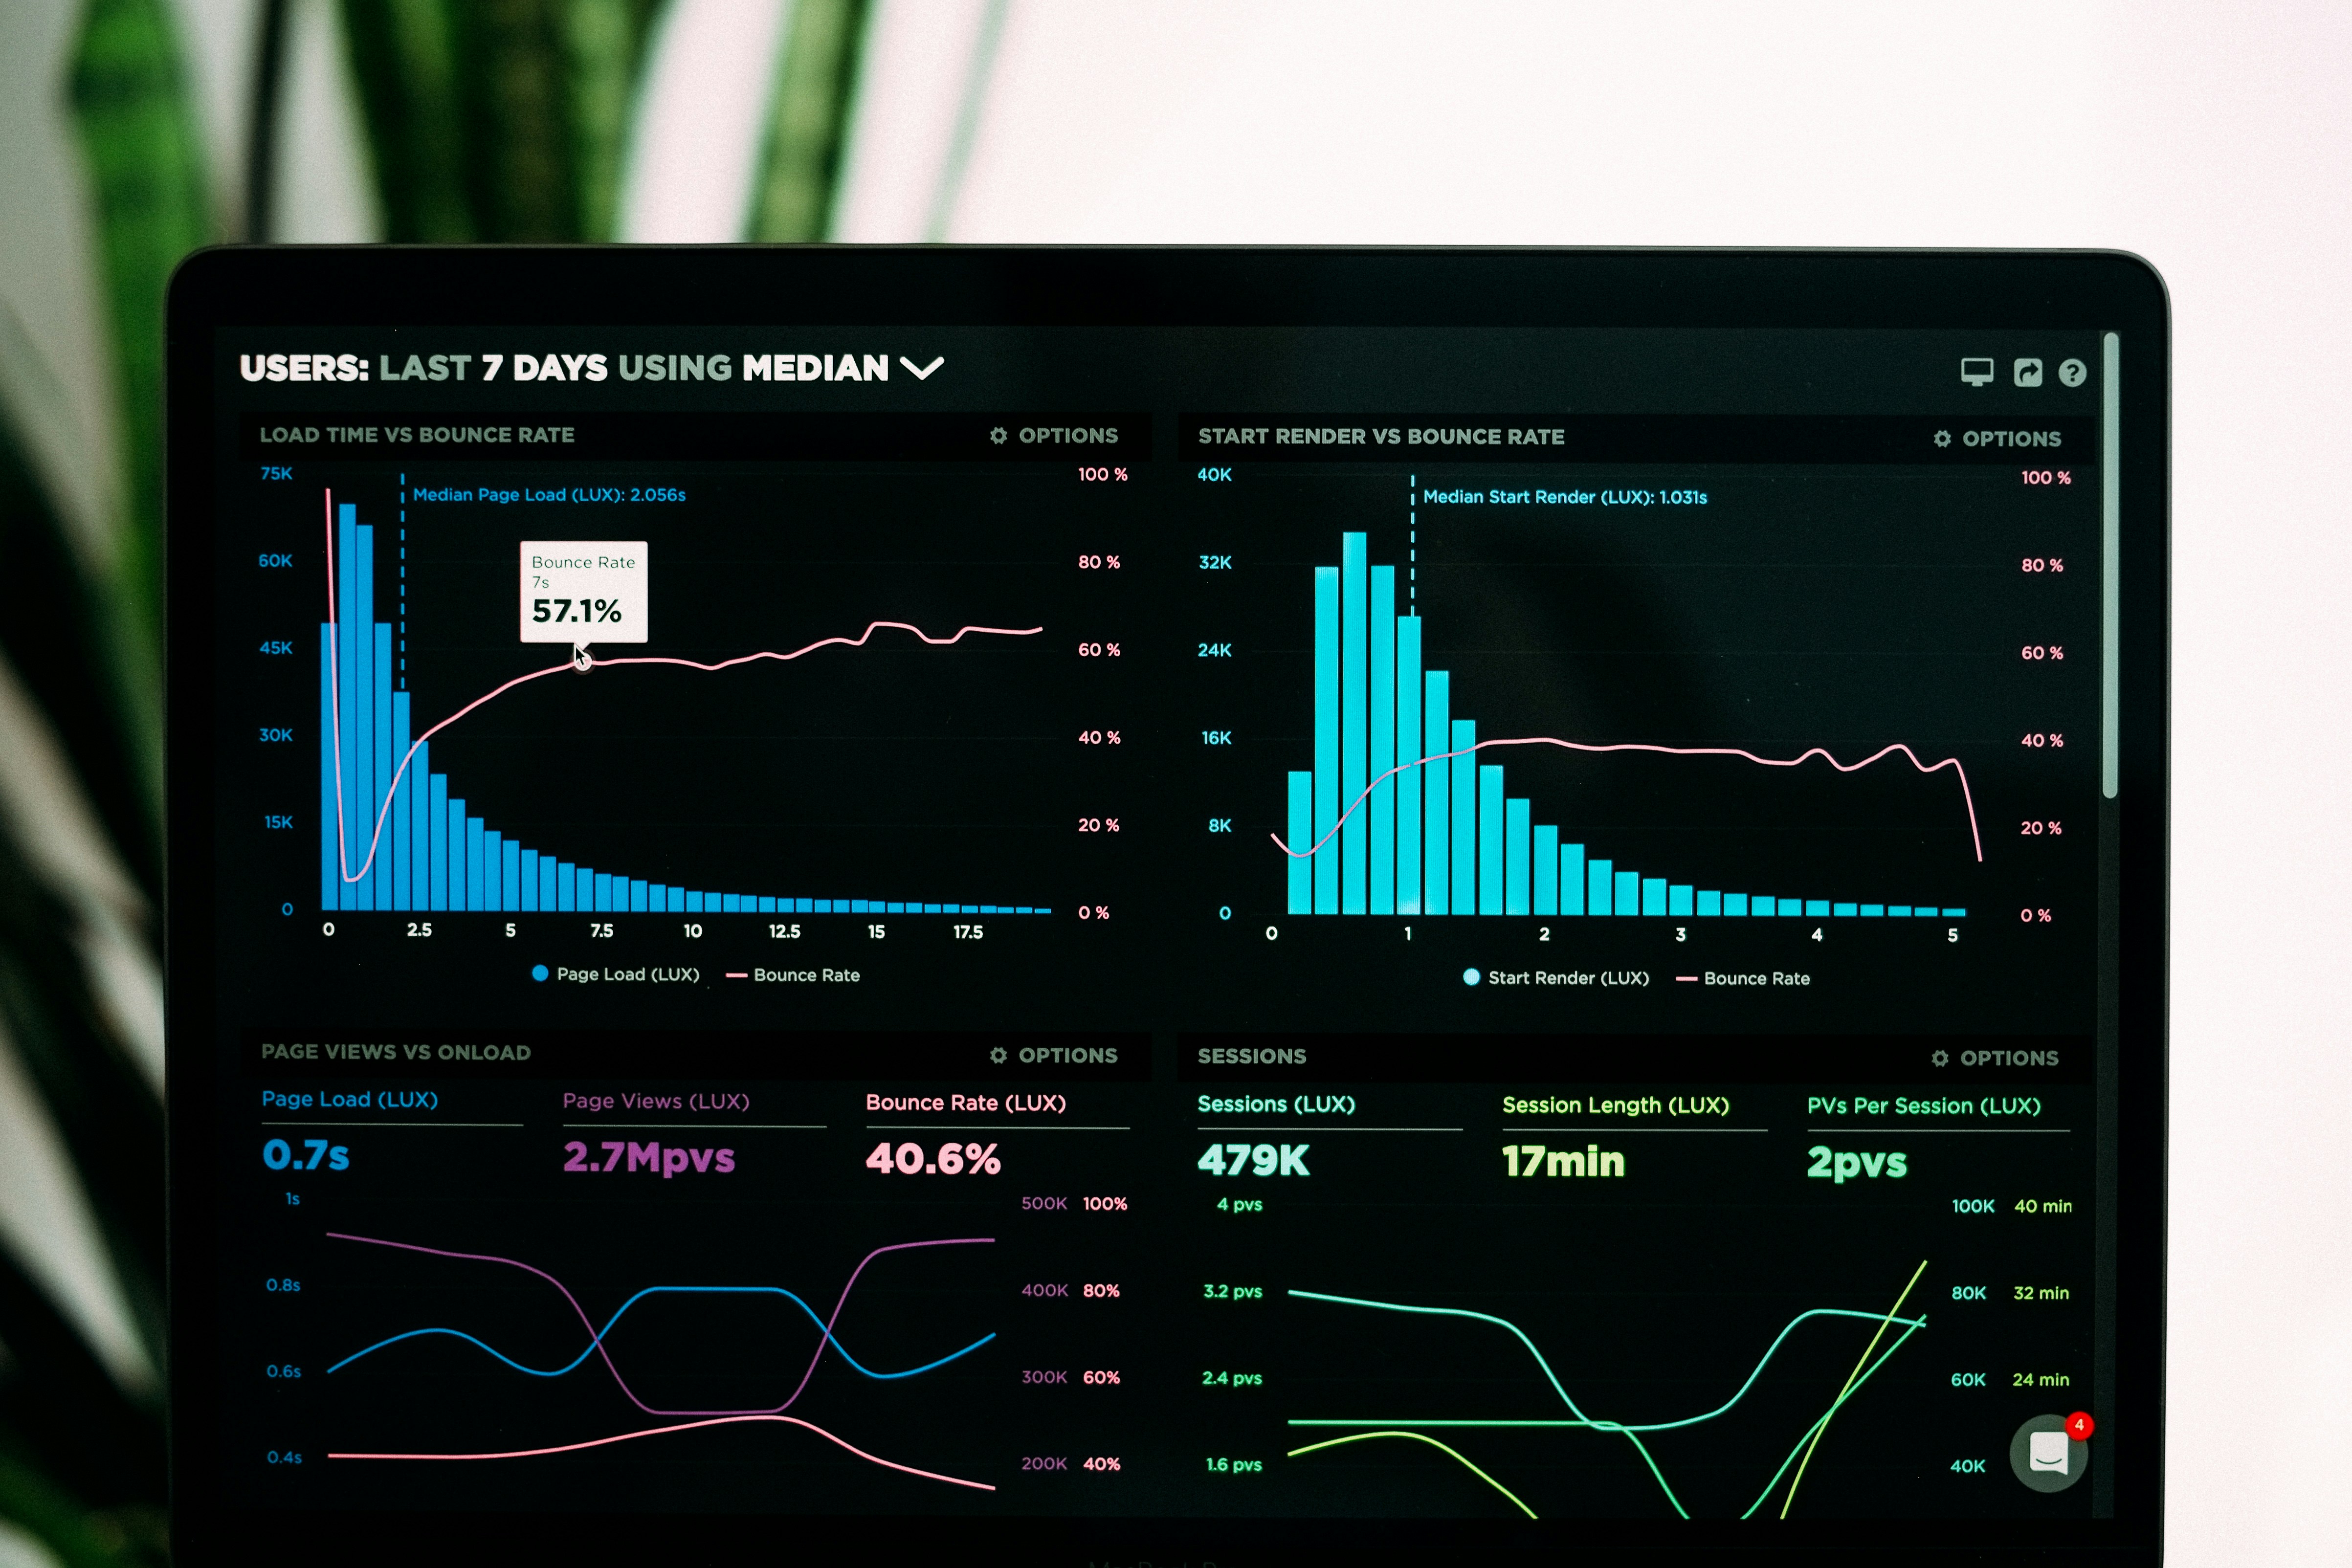
Trusted by Leading Companies






Everything You Need to Visualize Postgres
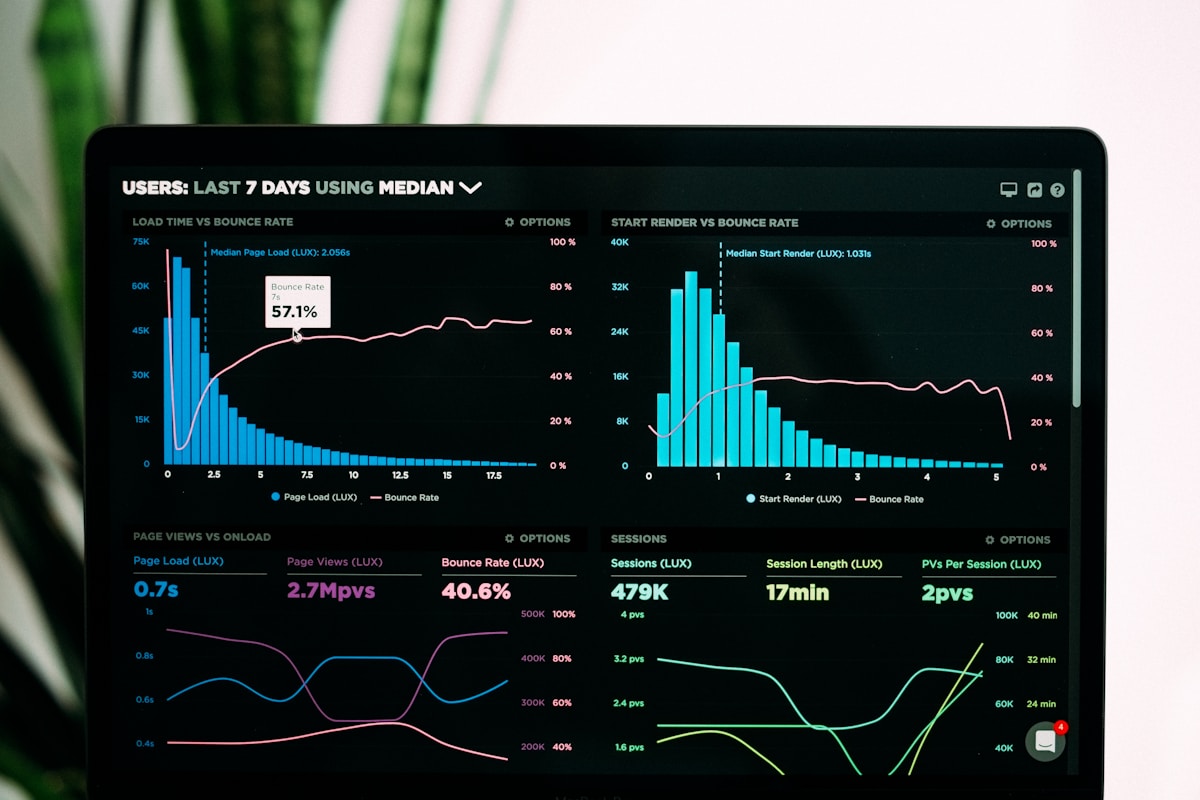
Transform complex SQL queries into beautiful, interactive charts and graphs. Our intelligent visualization engine automatically suggests the best chart types for your data, while giving you full control to customize every detail. Watch your data update in real-time as your Postgres database changes.
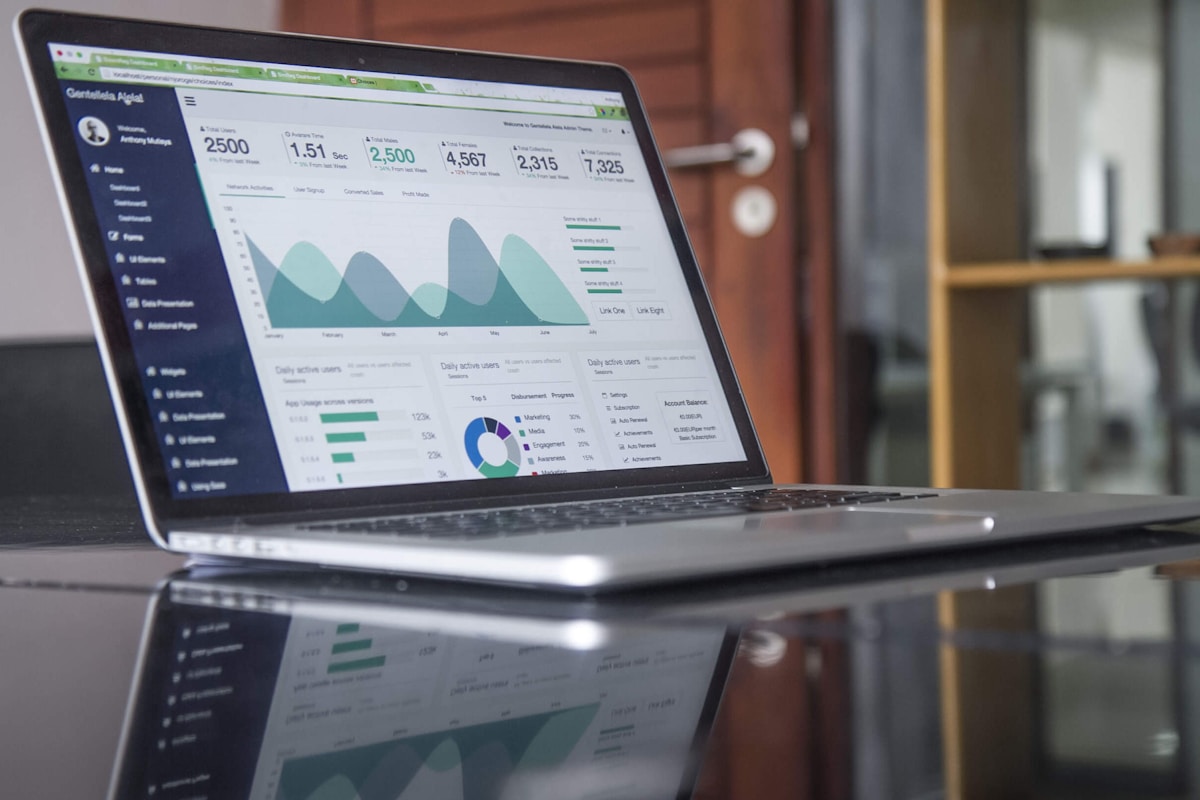
Build professional dashboards without writing a single line of code. Our intuitive drag-and-drop interface lets you arrange widgets, resize panels, and create custom layouts in minutes. Save templates for common use cases and share them across your team for consistent reporting.
Enterprise-grade security built in from the ground up. Configure role-based access controls, set up row-level security policies, and audit all dashboard access. Your Postgres credentials are encrypted at rest and in transit, with support for SSH tunneling and VPC peering for maximum security.
Stay informed with intelligent alerting that monitors your key metrics 24/7. Set custom thresholds, configure escalation policies, and receive notifications via email, Slack, or webhooks. Our anomaly detection uses machine learning to alert you to unusual patterns before they become problems.
Share insights with your entire organization effortlessly. Export dashboards as PDFs, schedule automated email reports, or embed live dashboards in your internal tools. Comment on specific data points, tag teammates, and create shared workspaces for cross-functional collaboration.



Get Started in Minutes
-
01
Connect Your Database
Simply enter your Postgres connection string and we'll securely connect to your database. Supports SSL, SSH tunnels, and read-only replicas for maximum security and performance.
-
02
Build Your First Dashboard
Use our intuitive drag-and-drop interface to create charts, tables, and metrics. Write SQL queries or use our visual query builder—no coding required for basic visualizations.
-
03
Share and Collaborate
Invite your team, set permissions, and share dashboards with stakeholders. Export reports, schedule email updates, and embed dashboards anywhere with our flexible sharing options.

See How Teams Use Postgres Dashboard

E-Commerce Platform Reduces Query Time by 85%
Challenge
ShopFlow was struggling with slow database queries that made it impossible to monitor their rapidly growing e-commerce platform in real-time. Their data team spent hours each day manually running queries and creating static reports that were outdated by the time they reached stakeholders.
Solution
By implementing Postgres Dashboard, ShopFlow created real-time dashboards for inventory management, sales tracking, and customer analytics. The drag-and-drop interface allowed non-technical team members to build their own views, reducing the burden on the data engineering team.
Results
Query response times dropped from an average of 6 seconds to under 900ms. The sales team now monitors live conversion rates and inventory levels, leading to a 23% reduction in stockouts and a 15% increase in revenue. The data team reclaimed 20 hours per week previously spent on manual reporting.

FinTech Startup Achieves SOC 2 Compliance
Challenge
PaymentHub needed comprehensive audit trails and access controls for their database analytics to meet SOC 2 compliance requirements. Their existing tools lacked the security features required for handling sensitive financial data, putting their certification timeline at risk.
Solution
Postgres Dashboard's enterprise security features provided role-based access control, complete audit logging, and encrypted connections. The team set up automated compliance reports and configured alerts for any unusual database access patterns.
Results
PaymentHub achieved SOC 2 Type II certification three months ahead of schedule. The audit team praised their comprehensive logging and access controls. They now serve 50+ enterprise clients who require strict security standards, opening up a new market segment worth $2M in annual recurring revenue.

Healthcare Provider Improves Patient Outcomes
Challenge
MediCare Regional Hospital needed to track patient wait times, bed availability, and treatment outcomes across five facilities. Their legacy reporting system updated only once per day, making it difficult to respond quickly to capacity issues or identify trends in patient care.
Solution
The hospital deployed Postgres Dashboard to create real-time operational dashboards accessible to administrators, department heads, and clinical staff. Custom alerts notify staff when wait times exceed thresholds or when specific resources become constrained.
Results
Average emergency room wait times decreased by 34% through better resource allocation. The hospital identified and addressed a medication administration delay that was affecting patient recovery times. Staff satisfaction scores improved by 28% due to reduced stress from better operational visibility.
SaaS Company Scales to 10M Users
Challenge
CloudSync was experiencing rapid growth but their homegrown analytics solution couldn't keep up. As their user base grew from 1M to 10M users, dashboard load times increased from seconds to minutes, and their infrastructure costs were spiraling out of control.
Solution
CloudSync migrated to Postgres Dashboard, leveraging its optimized query engine and intelligent caching. They created separate dashboards for product analytics, customer success, and engineering teams, each with appropriate access controls and refresh rates.
Results
Dashboard performance improved by 10x even with 10x more data. Infrastructure costs for analytics decreased by 60% through efficient query optimization. The product team now makes data-driven decisions daily instead of weekly, accelerating their feature release cycle by 40%.
Trusted by Data Teams Worldwide
Postgres Dashboard transformed how we monitor our database performance. Real-time insights that used to take hours of manual querying are now available at a glance. It's become indispensable for our data team.
What Our Customers Say

TechFlow Solutions
Reduced reporting time by 80%

ShopLocal
Empowered our entire team with data

HealthMetrics
Critical for regulatory compliance

SecureBank
Real-time fraud detection

CloudSync
Scaled from startup to enterprise

RetailPro
Unified analytics across 50 stores

Venture Capital Partners
Investment decisions backed by data

CareConnect
Patient outcomes improved 30%
Start Visualizing Your Postgres Data Today
Join thousands of data teams who trust Postgres Dashboard to turn their database into actionable insights. Get started in minutes with our free trial—no credit card required. Our team is here to help you build your first dashboard and unlock the full potential of your data.